Cloud Observability: How to Monitor Performance Across Multi-Cloud Environments
— VictoriaMetrics Cloud delivers scalable, efficient observability across AWS, Azure, GCP, and hybrid environments — all in one powerful platform.
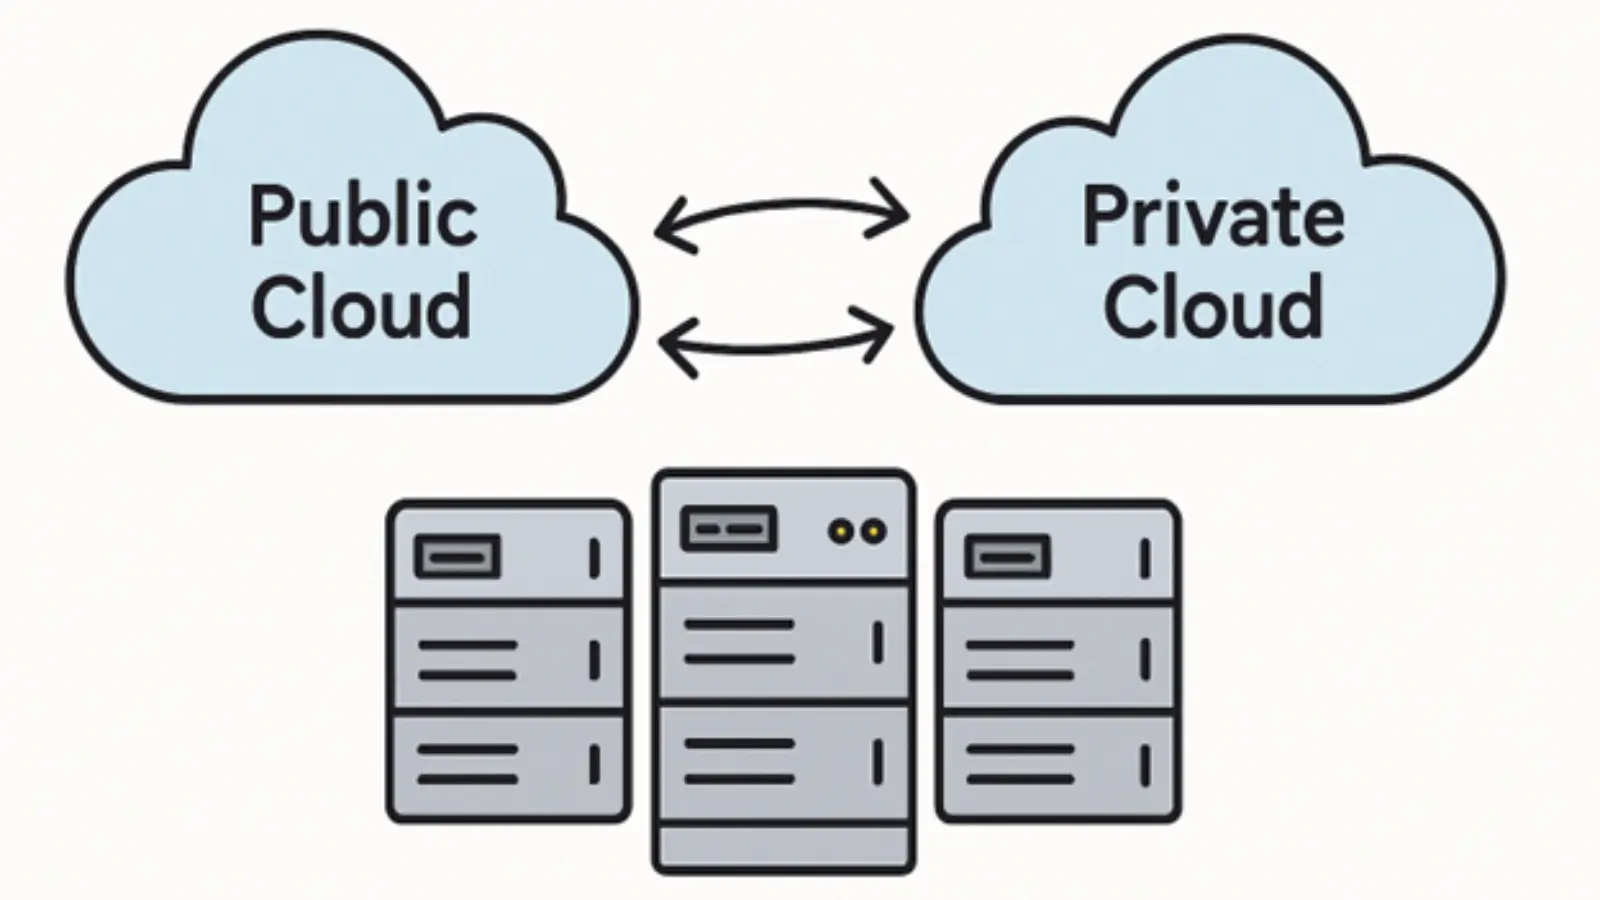
In today’s cloud-first world, organizations rarely depend on a single provider. Instead, they deploy applications across AWS, Google Cloud, Azure, and private data centers to ensure flexibility, redundancy, and cost efficiency. While this multi-cloud strategy offers immense benefits, it also introduces a major challenge: how to monitor performance and reliability across diverse, distributed environments.
That’s where cloud observability comes in, a modern approach to understanding complex systems through data-driven visibility. And with solutions like VictoriaMetrics Cloud, teams can achieve seamless observability across clouds, regions, and workloads with minimal operational overhead.
For expert SEO and performance analytics support, visit Best Digital Marketing Agency in London, RankTix, a UK-based digital agency dedicated to helping businesses grow their digital footprint.
What Is Cloud Observability?
Cloud observability is the ability to gain actionable insights into the performance, health, and behavior of applications and infrastructure across multiple cloud environments. It goes beyond traditional monitoring by collecting and analyzing metrics, logs, and traces, the three pillars of observability.
While monitoring tells you when something breaks, observability tells you why it happened, allowing teams to diagnose and resolve issues faster.
Why Multi-Cloud Observability Matters
The move toward multi-cloud architectures is inevitable. Organizations distribute workloads across multiple providers to:
-
Avoid vendor lock-in.
-
Optimize costs per workload.
-
Enhance global availability and redundancy.
However, this strategy complicates visibility. Each cloud provider has unique tools, APIs, and data models. Without a unified observability framework, teams struggle to correlate data, identify root causes, and maintain consistent SLAs.
Cloud observability bridges these gaps — enabling centralized data collection, visualization, and analysis from every environment in one place.
Challenges of Monitoring Multi-Cloud Environments
-
Data Fragmentation: Metrics and logs often reside in separate cloud-native tools (e.g., CloudWatch, Stackdriver, Azure Monitor).
-
Inconsistent Formats: Different telemetry structures make correlation complex.
-
High Costs: Managing multiple monitoring systems leads to duplicated data and higher storage expenses.
-
Scalability Issues: Traditional monitoring tools can’t keep up with the dynamic scaling of multi-cloud workloads.
-
Lack of Context: Without unified traces and metrics, pinpointing the source of latency or downtime becomes guesswork.
That’s why scalable, cloud-native observability software — like VictoriaMetrics — is critical for modern infrastructure.
The Role of VictoriaMetrics in Cloud Observability
VictoriaMetrics Cloud is designed for organizations operating in multi-cloud and hybrid environments. It combines performance, scalability, and simplicity, helping engineers observe everything from container-level metrics to distributed traces in one unified solution.
Key Capabilities:
-
Multi-Cloud Visibility: Collect data from AWS, Azure, GCP, and on-prem systems in real time.
-
High Compression: Up to 50:1 compression ratio for cost-efficient storage.
-
Seamless Integration: Compatible with Prometheus, Grafana, and OpenTelemetry.
-
Global Data Retention: Store data regionally to meet compliance and performance requirements.
-
Fully Managed Experience: No infrastructure to maintain, just connect, observe, and act.
This makes VictoriaMetrics Cloud an ideal platform for teams needing cost-efficient, reliable, and scalable observability across complex infrastructures.
Building an Effective Cloud Observability Strategy
Achieving robust multi-cloud observability requires the right approach and tools. Below are the key pillars of a successful strategy.
1. Unify Data Sources
Consolidate telemetry data from all clouds into a single observability platform. VictoriaMetrics supports multi-tenant architectures, allowing teams to centralize visibility across business units or regions while maintaining isolation.
2. Correlate Metrics, Logs, and Traces
Metrics reveal what is happening, logs show how, and traces identify where performance issues occur. Tools like VictoriaLogs and VictoriaTraces seamlessly connect these data types, giving engineers full context and faster root-cause analysis.
3. Automate Anomaly Detection
Manual monitoring doesn’t scale in multi-cloud systems. VictoriaMetrics Anomaly Detection uses machine learning to identify irregularities in real-time, reducing alert fatigue and enabling proactive remediation
4. Visualize for Insight, Not Just Data
Integrate dashboards like Grafana with VictoriaMetrics to visualize trends, detect anomalies, and forecast capacity needs. Visual context helps teams turn observability data into business decisions.
5. Optimize for Cost and Performance
Storage and query efficiency are critical. VictoriaMetrics achieves up to 10× lower resource consumption compared to traditional setups, ensuring you get full visibility without overpaying for cloud storage or compute.
Benefits of Cloud Observability with VictoriaMetrics
1. End-to-End Visibility
Monitor metrics from Kubernetes clusters on AWS, applications on Azure, and databases on GCP — all within one dashboard.
2. Enhanced Reliability
Quickly identify cross-cloud dependencies and bottlenecks that could lead to downtime.
3. Operational Efficiency
Reduce maintenance by using a fully managed service, freeing your team from scaling, updating, and managing infrastructure.
4. Faster Troubleshooting
Use VictoriaTraces and VictoriaLogs to connect service-level issues to their underlying metrics for precise diagnosis.
5. Lower Total Cost of Ownership (TCO)
VictoriaMetrics’ storage and query efficiency ensure that multi-cloud observability remains affordable, even at scale.
Real-World Application: Multi-Cloud Monitoring in Action
Imagine a fintech company running critical microservices on AWS and customer data analytics on GCP. They face high latency and limited visibility due to disconnected monitoring tools.
By adopting VictoriaMetrics Cloud:
-
They unify data ingestion from both clouds into one observability layer.
-
Query latency drops by 20×, accelerating root-cause detection.
-
Storage costs are reduced by up to 60% through advanced compression.
-
Alerts are automatically correlated across both environments.
The result: faster insights, lower costs, and a stable, predictable system all from a single observability stack.
Integrating VictoriaMetrics with AWS, GCP, and Azure
VictoriaMetrics seamlessly connects with cloud-native services such as:
-
AWS Managed Prometheus
-
Azure Monitor Metrics
-
Google Cloud Operations Suite
This enables you to collect, store, and query telemetry data without complex configurations. Integration is lightweight, agent-based, and fully compatible with PromQL, ensuring a smooth transition from existing Prometheus setups.
To learn more about integration, explore VictoriaMetrics Managed Services a cloud-native solution designed to streamline setup and operations.
The Future of Cloud Observability
As enterprises adopt edge computing, serverless architectures, and AI-driven operations, observability must evolve. The next generation of observability will be:
-
Proactive: Predicting failures using ML models.
-
Unified: Bridging metrics, logs, and traces into one adaptive system.
-
Sustainable: Reducing infrastructure energy usage and costs.
VictoriaMetrics is already advancing this vision through its sustainability initiatives and continuous product innovation, ensuring observability remains efficient, transparent, and future-ready.
Conclusion
Multi-cloud environments offer flexibility and resilience, but they also demand smarter observability. To truly understand performance across clouds, organizations need tools that scale seamlessly, provide actionable insights, and simplify complexity.
VictoriaMetrics Cloud delivers exactly that, an all-in-one observability solution built for the modern, distributed world. It helps teams gain full visibility, optimize costs, and enhance performance without sacrificing simplicity.
To explore how VictoriaMetrics can elevate your multi-cloud observability strategy, visit our cloud observability solutions

