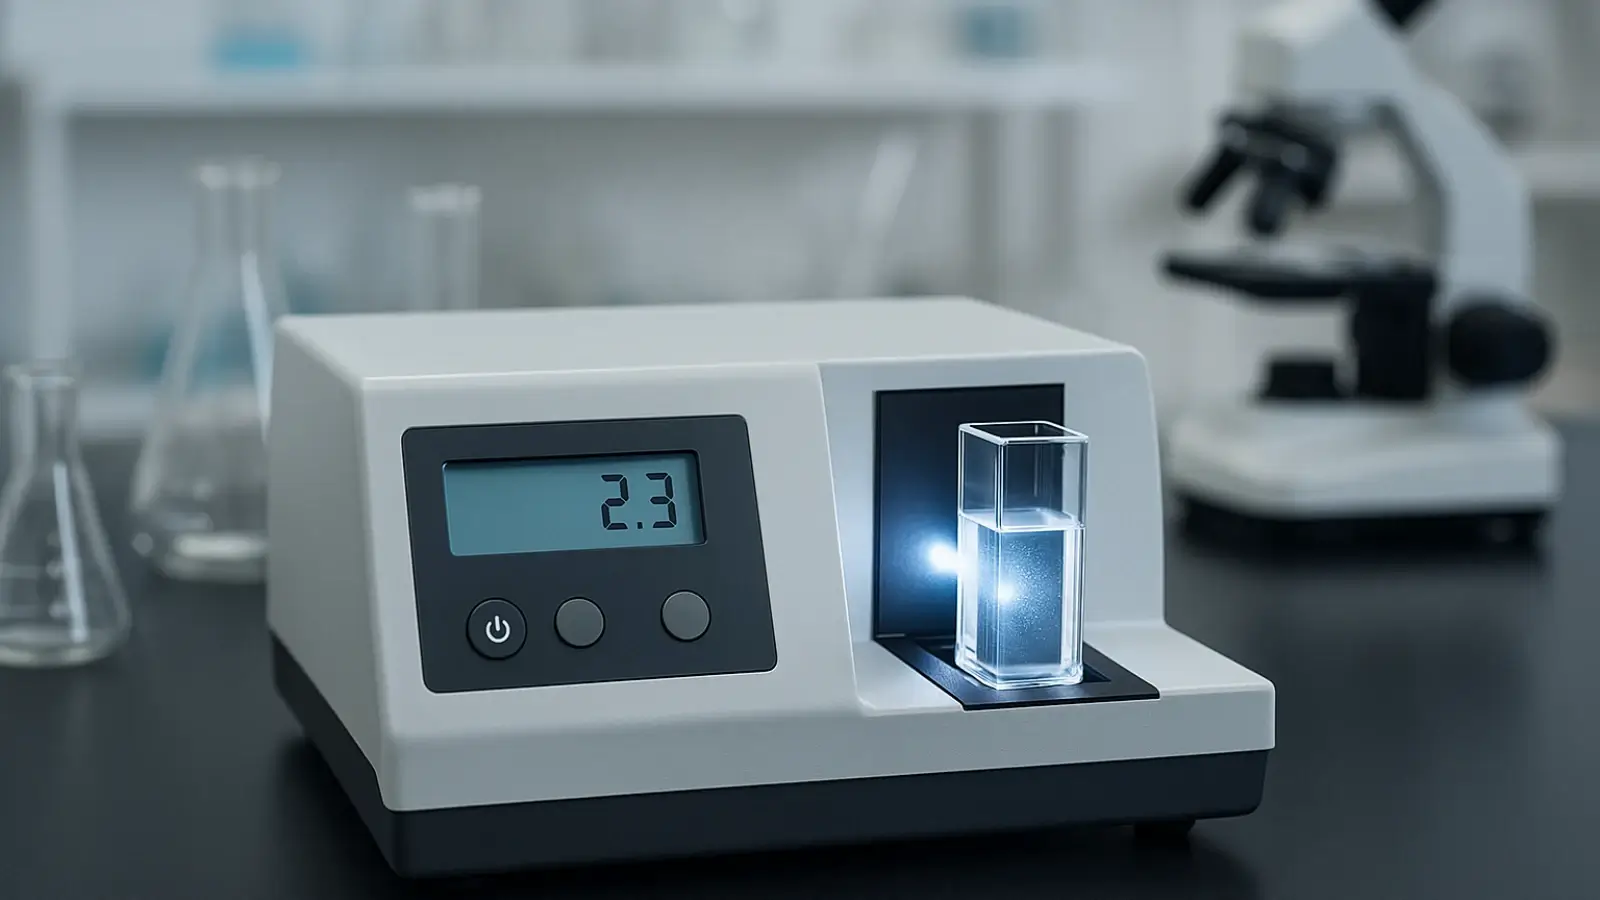
Nephelometry is a powerful analytical technique used to measure the scattering of light by particles suspended in a liquid or gas medium. When a beam of light passes through a sample containing dispersed particles, those particles scatter the light in various directions. By measuring the intensity of this scattered light, researchers can determine the concentration and properties of the suspended particles.
Researchers use a nephelometer to measure the concentration of suspended particles in a liquid or gas. Widely used in clinical diagnostics, chemical analysis, environmental monitoring, and pharmaceutical research, nephelometry offers a reliable method for quantifying particles in complex mixtures. Understanding its core principles is essential for unlocking its full potential across scientific disciplines.
Principles of Nephelometry
At the heart of nephelometry is the phenomenon of elastic light scattering. When light interacts with particles in a solution or gas, the photons are redirected without a change in their energy—meaning no energy is absorbed by the particles. The result is elastic scattering, and the pattern and intensity of this scattering provide insights into the sample.
-
Light Scattering Behavior
When a beam of light is passed through a sample containing suspended particles, the incident light interacts with these particles. Some of the light gets scattered in different directions because of the interaction with the particles. The amount of scattering is directly proportional to the concentration of the particles in the sample and their properties, including shape, size, and refractive index.
-
Detection Angle
With nephelometry, researchers measure the scattered light at a specific angle relative to the incident light beam. The choice of angle at which the light is detected depends on the particular application and the size range of particles that are being analyzed. Researchers commonly use right angles (perpendicular to the incident beam) and several other angles based on the requirements and the instrument.
-
Calibration
Converting the measured intensity of the scattered light into a quantitative measure of particle concentration requires precision and several considerations. To achieve accurate measurements, researchers calibrate nephelometers using standards of known particle concentrations. These standards help establish a linear relationship between scattered light intensity and particle concentration.
-
Specificity of the Target Analyte
In many applications, researchers add specific reagents or antibodies to the sample to create particle complexes or aggregates. They further use nephelometry to analyze these complexes. In most cases, the formation of these complexes is proportional to the concentration of a specific analyte (such as a protein) in the sample. These complexes scatter light differently from individual particles. Researchers use the intensity of scattered light to quantify the concentration of the target analyte.
-
Analysis of Data
Researchers process the data collected from nephelometry to determine the concentration of particles in the sample. This process typically involves comparing the measured scattered light intensity to a calibration curve or standard curve generated from known particle concentrations. This
Applications of Nephelometry
Nephelometry has several applications across various fields, including chemistry, environmental monitoring, clinical diagnostics, and materials science. It is most commonly used for monitoring air or water quality, particle size distribution analysis, assessing the quality of colloidal systems and suspensions, and measuring the concentration of specific analytes in clinical samples.
In pharmaceutical laboratories, researchers use nephelometry to determine the solubility of drugs or compounds. This method is also useful in quantifying microbial growth. Nephelometry is widely used to count the cells in microorganism suspensions like yeast.
Conclusion
Nephelometry is a highly precise and accurate method that allows researchers to analyze a wide range of particle sizes. While you can conduct various drug solubility assays or monitor air/water quality using this method, having a clear idea about the principles of nephelometry can help you better understand the data and drive more accurate outcomes.
Business Outstanders brings you sharp insights on tech, business, entrepreneurship, law, crypto, and more. We uncover what’s next. Stay updated, sign up for our newsletter and be part of the future!