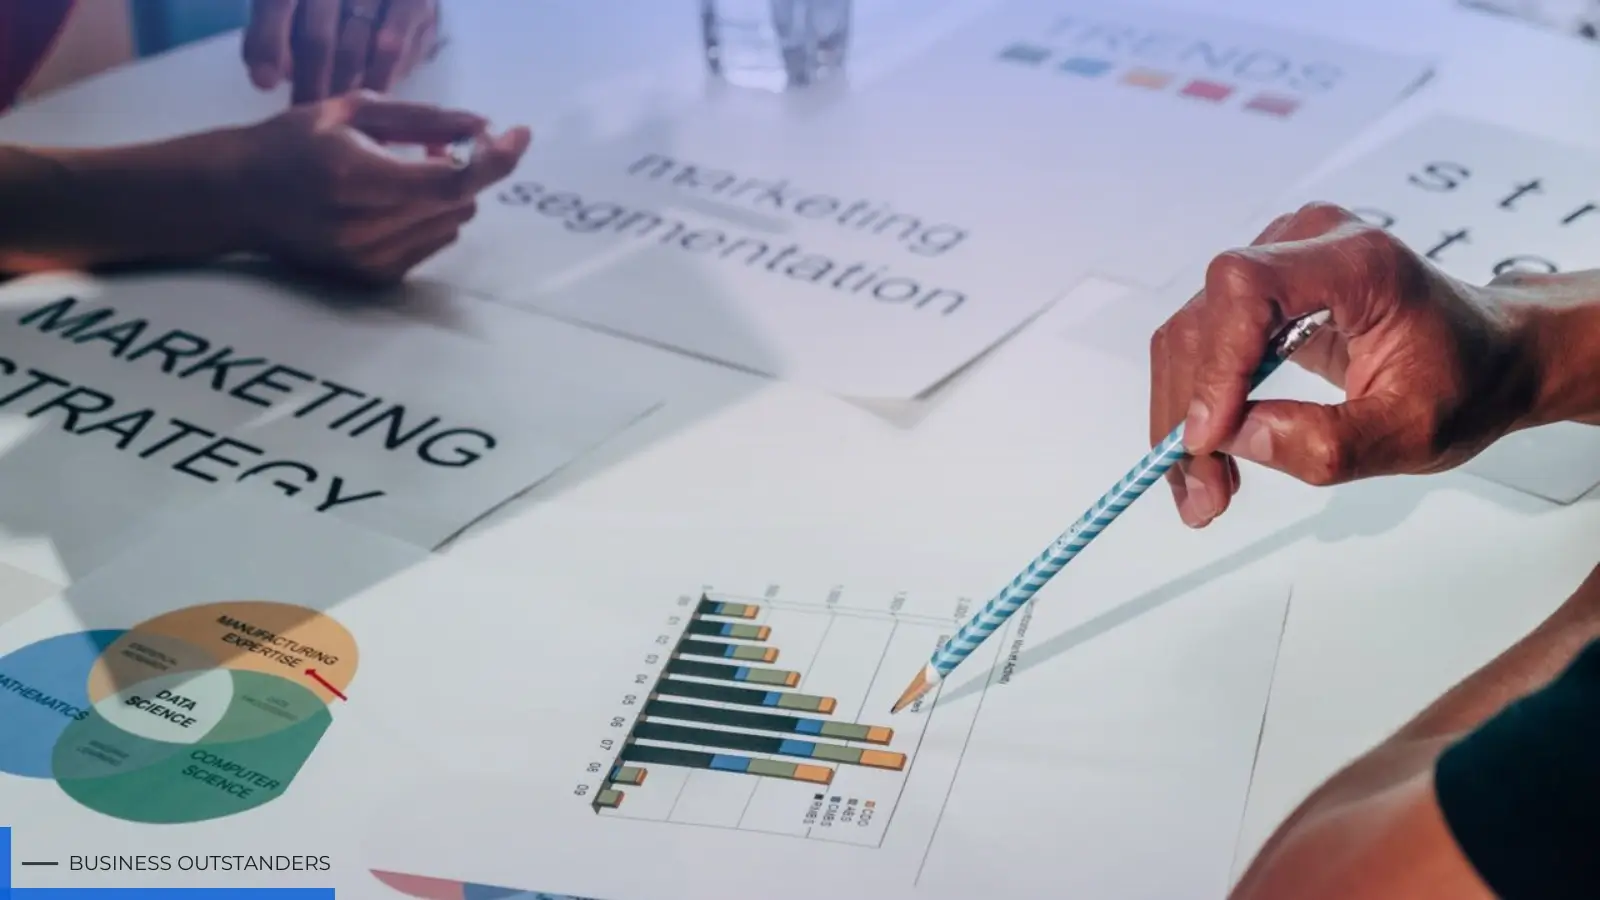
Introduction: Why Sales Performance Metrics Matter
Knowing exactly how your sales team performs begins with tracking the accurate data. At an earlier stage of the process, businesses do a lot to improve their online presence with support from partners such as website design by OWDT, yet successful sales conversion really does require tracking the key signals indicating if your pipeline is progressing. By focusing on key measurements, you can more intelligently manage your business and reinforce your overall revenue model.
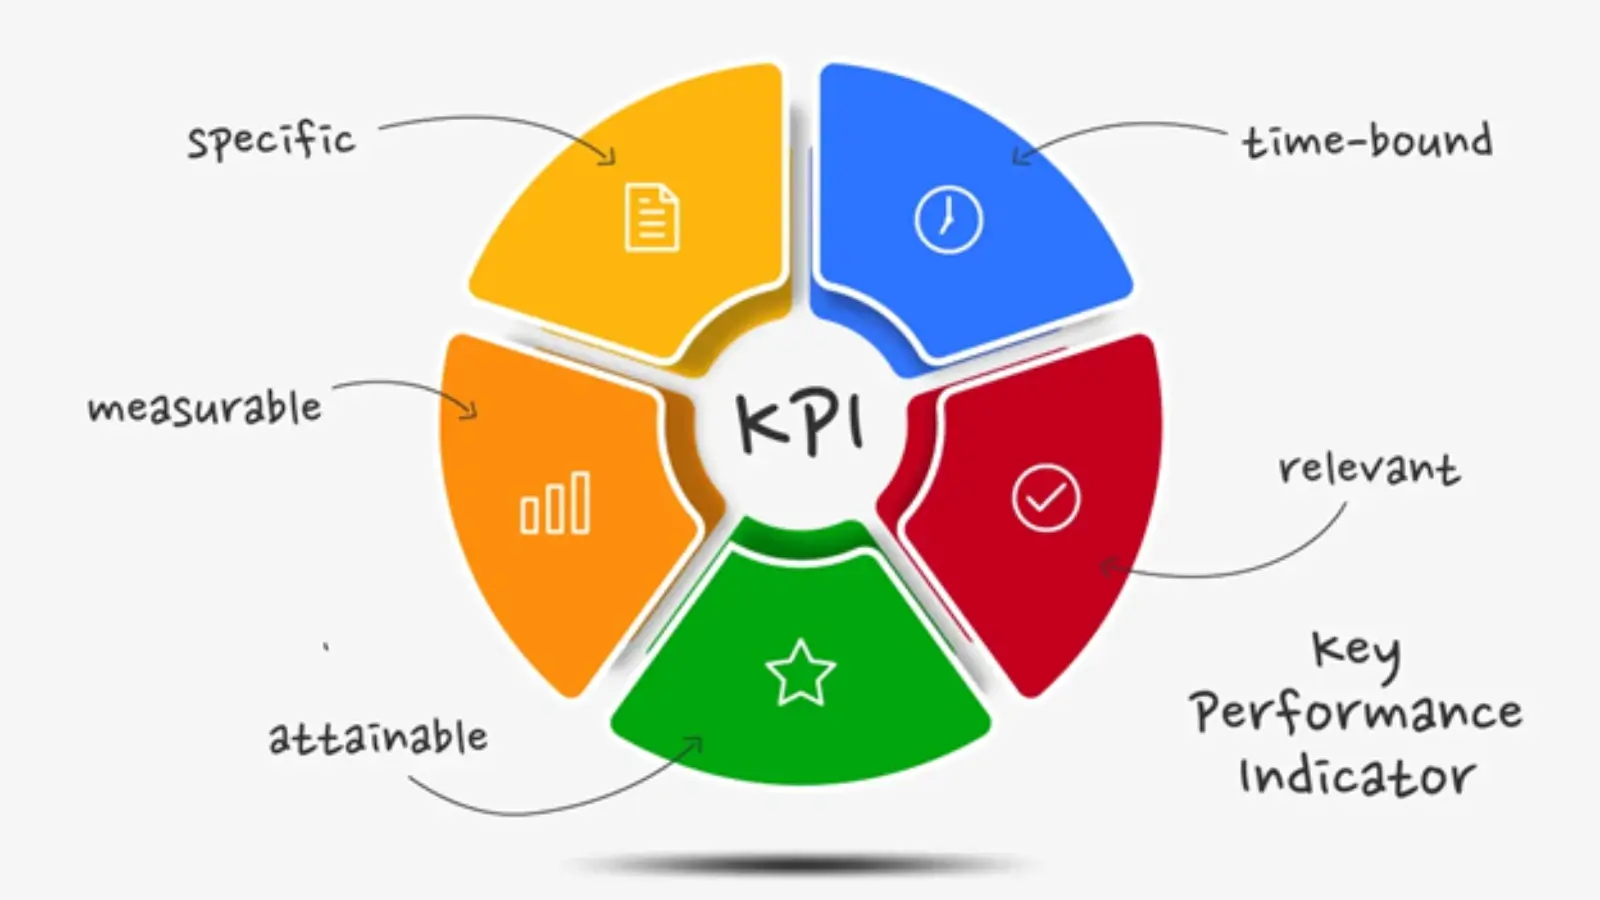
Why Tracking KPIs Matters
Sales KPIs provide a clear picture of what’s working and what needs attention. You’re not guessing anymore; you have visibility into how your customers are behaving, what your team is doing and future revenue. Track the relevant numbers to:
- Spot problems early
- Improve training
- Set better goals
- Strengthen forecasting
- Understand customer patterns
But if you do that consistently, then you build a sales practice that’s consistent and easier to manage.
Lead Conversion Rate
This is the measure of the proportion between leads and paying customers. A high conversion rate means your messaging isn’t muddled and your team is targeting the right leads. If not, for potential explanations, think about slow follow-ups, confusing offers, or stages where prospects lose interest.
Sales Cycle Length
Sales cycle length is the time it takes to complete a deal from first contact. Shorter cycles mean your team can work more opportunities. If it seems too long, investigate whether proposals are being held up, decision-makers are brought in sufficiently late or the process is unclear at various turns along the way.
Customer Acquisition Cost (CAC)
CAC is a metric that shows how much you’re spending to acquire one new customer. This takes into account marketing and sales cost. Sustaining a Healthy CAC Keeping your CAC at healthy levels will enable you to grow sustainably. Easing this burden can be achieved by increasing lead quality, refining targeting, or automating manual duties.
Customer Lifetime Value (CLV)
CLV measures how much revenue a customer brings over the lifetime of a relationship. In contrast to CAC, it’s what tells you if your acquisition efforts are actually profitable. Better onboarding, loyalty efforts, helpful support, upsells — these are all ways to improve CLV.
Win Rate
Win rate is the percentage of opportunities your team closes. The greater the win rate, the healthier your pipeline and more effective your process. Tracking this over time reveals trends — which industries are best responding or which sales reps company performs better with specific types of deals.
Average Deal Size
Average deal size indicates what your standard sum of revenue from a closed-won deal will be. It offers assistance in establishing goals, comparing performance and gaining insight into which customer groups are delivering the most value. To fix this metric, maybe you can offer upgrades or more expensive bundles.
Sales Pipeline Value
Pipeline value represents the potential revenue from all active opportunities. A healthy pipeline should have a range of early-stage to late-stage deals. Low value could indicate a lead gen problem, and inconsistent in value can indicate irregular qualification.
Activity Metrics
Activity metrics monitor the activities that drive deals — calls placed, emails sent, meetings scheduled, demos given and proposals shared. These numbers offer valuable context. If revenue is sliding but there’s no letup in activity, it might be a lead quality problem rather than an effort one.
Final Thoughts
By monitoring the right sales performance metrics you stay focused on what really generates results. Rather than staring at way too many numbers, know the KPIs that line up with your goals and revisit them on a regular basis. With time, this tactic is helpful for detecting trends, updating forecasts and building your best tax strategy in the long run.
Business Outstanders brings you sharp insights on tech, business, entrepreneurship, law, crypto, and more. We uncover what’s next. Stay updated, sign up for our newsletter and be part of the future!